Uzbekistan’s Foreign Trade Turnover (January–April 2025)
- News
- 27.05.2025
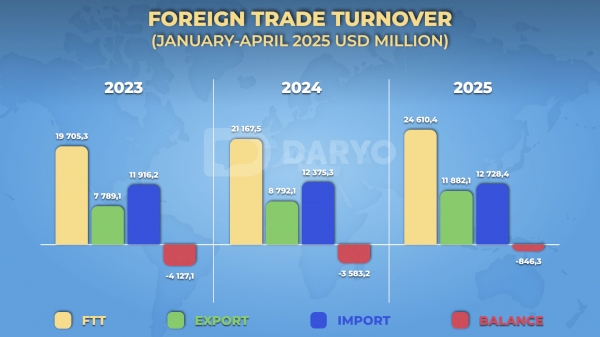
Uzbekistan’s foreign trade turnover for January–April 2025 reached $24.6 billion, marking a robust 16.3% increase, or $3.44 billion, compared to the same period in 2024. Exports surged to $11.88 billion (up 35.1%), while imports grew to $12.73 billion (up 2.9%), resulting in a trade deficit of $846.3 million. These figures highlight Uzbekistan’s growing global trade presence, driven by strong exports of non-monetary gold, agricultural products, and services, alongside strategic imports supporting economic modernization.
Major Trading Partners
Uzbekistan engages in trade with 183 countries, strengthening ties with key partners and expanding into new markets. Below is a detailed breakdown of the top trading partners for overall trade turnover, exports, and imports.
Overall Foreign Trade Turnover
- China: $4.18 billion (17.0% of total turnover, up 5.1%). China remains the top partner, supplying machinery and equipment while importing Uzbek textiles and agricultural products.
- Russia: $3.71 billion (15.1%, down 3.0%). Russia is a key market for Uzbek fruits, vegetables, and services, while supplying energy and industrial goods.
- Kazakhstan: $1.39 billion (5.7%, up 13.7%). A vital regional partner, Kazakhstan imports Uzbek food products and exports chemicals.
- Turkey: $834.0 million (3.4%). Turkey purchases Uzbek textiles and agricultural goods, while supplying construction materials and equipment.
- South Korea: $584.1 million (2.4%). South Korea imports Uzbek metals and exports high-tech equipment.
- Afghanistan: $504.5 million (2.1%, up 57.9%). A fast-growing market for Uzbek food and construction materials.
- India: $383.0 million (1.6%, up 36.4%). India imports Uzbek chemicals and textiles while supplying pharmaceuticals.
These seven countries account for approximately 47.3% of Uzbekistan’s foreign trade turnover, underscoring their critical role in the economy.
Exports by Country
Uzbekistan’s export growth is driven by demand from key partners:
- China: $1.45 billion (12.2% of total exports). Key exports include textiles (yarn and finished goods), vegetables, fruits, and chemicals.
- Russia: $1.28 billion (10.8%). Major exports include fruits, vegetables, textiles, and services (tourism and transport).
- Kazakhstan: $0.68 billion (5.7%). Strong demand for food products and construction materials.
- Turkey: $0.42 billion (3.5%). Primarily textiles and agricultural products.
- Afghanistan: $0.38 billion (3.2%, up 57.9%). Exports include food, construction materials, and textiles.
- Kyrgyzstan: $0.29 billion (2.4%, up 20.8%). Food and textiles dominate.
- Tajikistan: $0.25 billion (2.1%, up 15.6%). Exports include agricultural products and energy.
Imports by Country
Imports support Uzbekistan’s industrialization and domestic demand:
- China: $2.73 billion (21.4% of total imports). Key imports include specialized and electrical machinery, chemicals, and industrial goods.
- Russia: $2.43 billion (19.1%). Imports include energy, industrial equipment, and chemicals.
- Kazakhstan: $0.71 billion (5.6%). Supplies chemicals and food products.
- Turkey: $0.41 billion (3.2%). Imports construction materials and machinery.
- South Korea: $0.35 billion (2.7%). Provides high-tech equipment and electronics.
- Germany: $0.30 billion (2.4%). Supplies specialized machinery and chemicals.
- India: $0.22 billion (1.7%, up 36.4%). Imports pharmaceuticals and industrial goods.
Growing trade with Afghanistan and India reflects Uzbekistan’s focus on diversifying partnerships, while China and Russia remain primary suppliers of capital goods.
Regional Contributions
Tashkent city leads with $8.05 billion (32.7% of total turnover), contributing $1.86 billion in exports (15.7%, up 21.8%) and $6.18 billion in imports (48.6%). Other regions show strong growth:
- Tashkent Region: $1.82 billion (7.4%, up 11.2%), with $0.59 billion in exports and $1.23 billion in imports.
- Samarkand Region: $1.15 billion (4.7%, up 19.9%), with $0.34 billion in exports (up 35.8%) and $0.82 billion in imports.
- Fergana Region: $0.68 billion (2.8%, up 33.9%), with $0.20 billion in exports and $0.48 billion in imports.
- Surkhandarya Region: $0.27 billion (1.1%, up 198.0%), with $0.14 billion in exports and $0.14 billion in imports.
Regions like Surkhandarya and Fergana demonstrate rapid growth, supporting economic decentralization.
Export Structure
Exports reached $11.88 billion, up 35.1%, driven by non-monetary gold, agriculture, services, and industrial goods.
Service Exports
Services accounted for $2.51 billion (21.1% of exports, up 36.4%):
- Tourism: $1.18 billion (47.2%), fueled by growing global interest in Uzbekistan.
- Transport services: $0.93 billion (36.9%), supported by logistics improvements.
- Telecommunications and IT: $0.24 billion (9.4%).
- Business, insurance, and financial services: $0.16 billion (6.5%).
Goods Exports
Key export categories include:
- Food Products and Live Animals: $663.6 million (up 140.5%)
- Vegetables and fruits: $429.3 million (141.9%), including fresh and dried produce.
- Cereals and products: $170.6 million (133.6%).
- Dairy and eggs: $25.0 million (246.8%).
- Textiles: $839.4 million (7.1%, down 17.2%)
- Finished textile products: $389.5 million (46.4%).
- Yarn: $282.0 million (33.6%).
- Mineral Fuels: $417.6 million (up 121.8%)
- Natural gas: $199.7 million (185.0%).
- Oil and petroleum products: $145.6 million (81.2%).
- Chemicals: $602.1 million (up 117.6%)
- Inorganic chemicals: $338.9 million (113.1%).
- Fertilizers: $126.2 million (161.2%).
- Non-Monetary Gold: $3.68 billion (31.0% of exports, up 48.2%). A major driver of export growth, non-monetary gold is primarily shipped to Asian and European markets, bolstering foreign exchange reserves.
- Industrial Goods: $204.5 million (up 89.3%)
- Non-ferrous metals: $455.3 million (100.9%).
- Machinery and Transport Equipment: $336.2 million (up 105.7%)
- Vehicles: $90.4 million (76.4%).
Non-monetary gold has emerged as a cornerstone of Uzbekistan’s export strategy, significantly enhancing economic stability.
Import Structure
Imports totaled $12.73 billion, up 2.9%, supporting industrialization and rising domestic demand.
Service Imports
Services reached $1.34 billion (10.5%, up 38.6%):
- Tourism: $0.75 billion (55.5%).
- Transport services: $0.27 billion (20.2%).
- Telecommunications and IT: $0.13 billion (9.8%).
Goods Imports
Key import categories include:
- Machinery and Transport Equipment: $4.32 billion (33.9%, down 5.1%)
- Specialized machinery: $884.8 million (103.5%).
- Industrial equipment: $749.1 million (111.9%).
- Electrical machinery: $611.9 million (100.1%).
- Industrial Goods: $2.07 billion (16.3%, up 5.0%)
- Metal products: $64.2 million (158.2%).
- Chemicals: $1.65 billion (13.0%, up 7.7%).
- Food Products: $1.28 billion (10.1%, up 13.7%)
- Cereals: $304.3 million (103.7%).
- Meat: $196.9 million (166.7%).
- Mineral Fuels: $0.97 billion (7.6%, down 27.4%).
Imports of machinery and equipment drive industrial growth, while food imports meet rising consumer demand.
Trade Balance and Outlook
The trade deficit of $846.3 million is offset by robust export growth (35.1%), particularly in non-monetary gold, agriculture, and services. Uzbekistan is steadily enhancing its global trade position.
Conclusion
Uzbekistan’s foreign trade turnover for January–April 2025 reflects strong growth, driven by non-monetary gold, agricultural exports, and services. Strengthened ties with China, Russia, Kazakhstan, and emerging partners like Afghanistan and India signal bright prospects. Strategic imports continue to support economic modernization.
All information was obtained from the website www.invexi.org